Profiling :
is a form of dynamic program analysis that measures, for example, the space (memory) or time complexity of a program, the usage of particular instructions, or the frequency and duration of function calls. Most commonly, profiling information serves to aid program optimization.
How can you profile your golang REST API server in a super simple way :
First : add some lines to your server code
import _ "net/http/pprof"
And then add a listener (I normally use a command line flag to trigger this) :
go func() {
http.ListenAndServe("localhost:6000", nil)
}()
Start your server and generate some load. While your code is running under the load you generated extract the profiler data :
go tool pprof http://localhost:6000/debug/pprof/profile
Fetching profile over HTTP from http://localhost:6000/debug/pprof/profile
Saved profile in /home/paul/pprof/pprof.wm-server.samples.cpu.008.pb.gz
File: wm-server
Build ID: c806572b51954da99ceb779f6d7eee3600eae0fb
Type: cpu
Time: Dec 19, 2018 at 1:41pm (CET)
Duration: 30.13s, Total samples = 17.35s (57.58%)
Entering interactive mode (type "help" for commands, "o" for options)
(pprof)
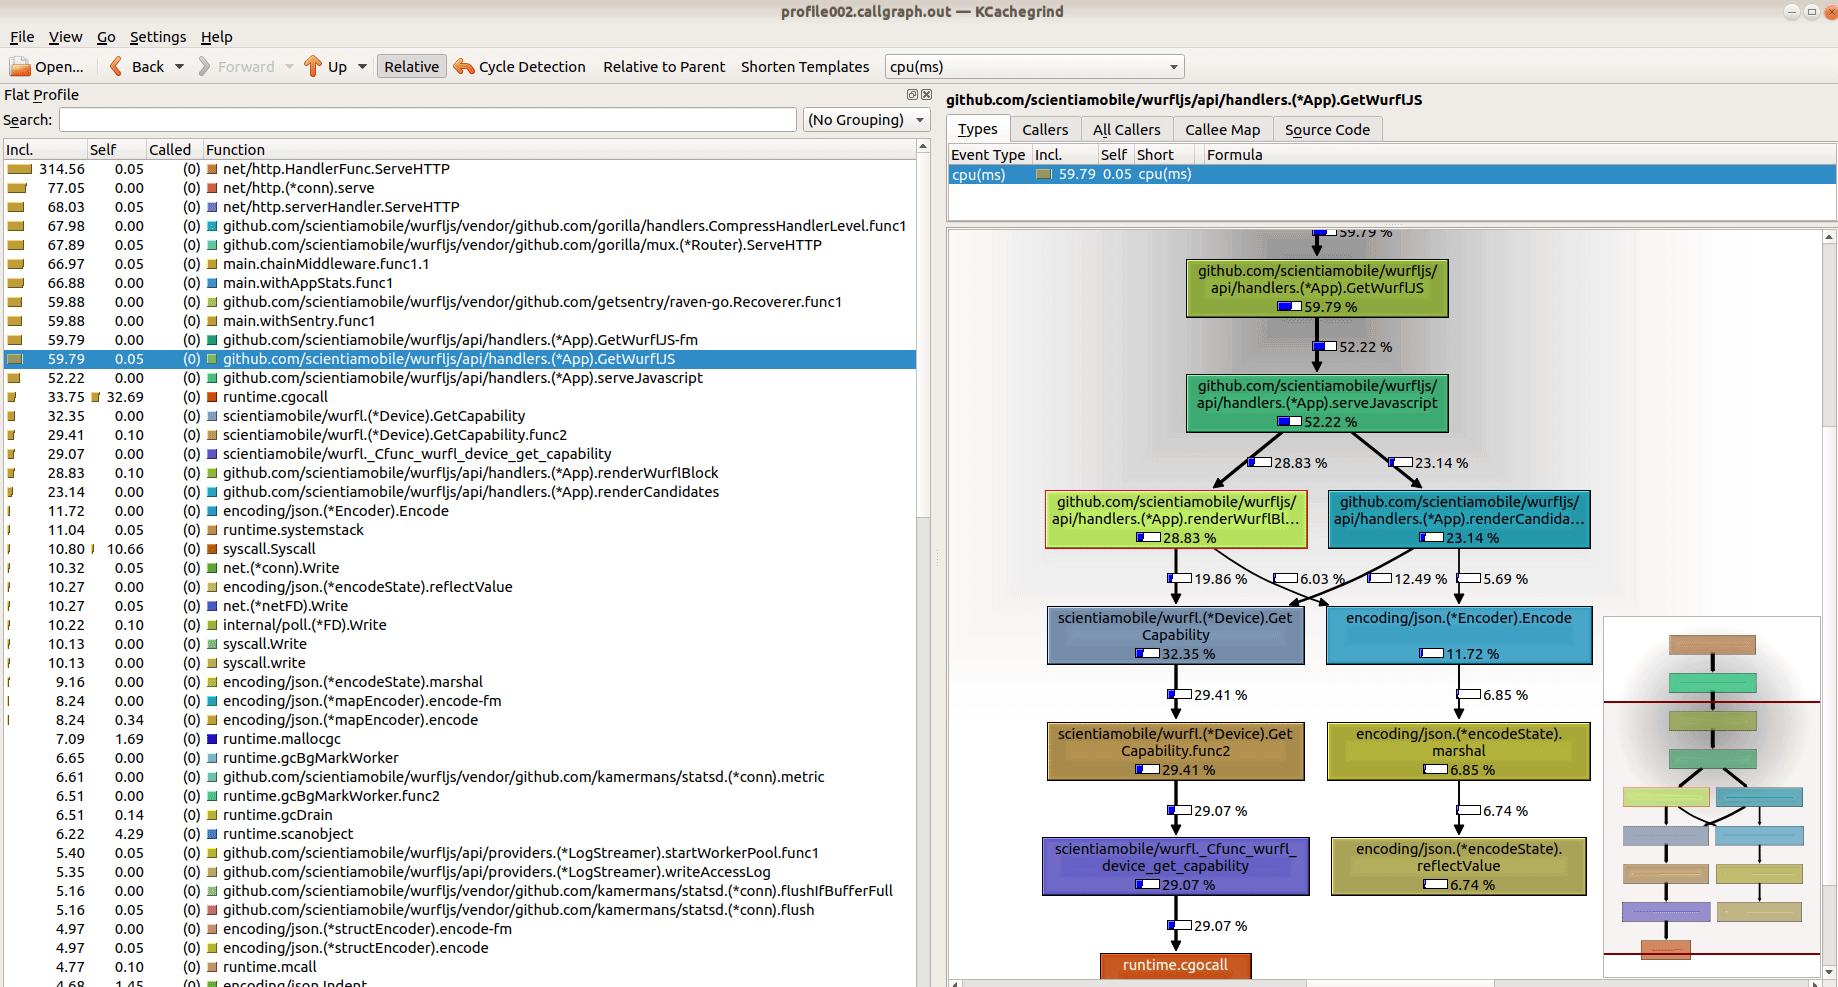
You have many commands at this point but what I prefer to do, having used kcachegrind for years, is to fire it up using the kcachegrind command :
(pprof) kcachegrind
This will generate a callgrind formatted file and run kcachegrind on it to let you do all the usual analysis that you’re probably already used to do (call graph, callers, callees ..)